Business Intelligence and Business Analytics Tools
Business Intelligence and Business Analytics Tools
You’ve probably heard these buzzwords before, but what do they really mean.
Business intelligence – deals with what happened in the past and how it happened. It identifies trends, patterns, and not too much into the why’s or predicting the future.
Business analytics – Deals with the why’s of what happened in the past. It breaks down contributing factors and causality. It also uses these why’s to make predictions of what will happen in the future.
So now that you have the definitions, what are some use cases?
If you are a business owner, it’s crucial to understand how your business is performing. You can use BI (Business Intelligence) to do that. Here are some examples:
- View how sales are performing each month.
- See who your top salespeople are.
- Which stores are performing the best?
- What are your top-selling products?
As a CFO, you to see more financial information. Here are some examples:
- Cash balance over time.
- The top 5 customers that owe you money.
- View various ratios like quick ratio, current ratio, and inventory turnover rates.
All this information helps give you a snapshot of the health of your company. A useful BI tool should allow you to see this data and drill into the numbers to get more insights.
Here’s an example of a financial health dashboard created in Zoho Analytics. Financial Health
You can also create KPIs (key performance indicators) and visually track them. You can set goals for revenue, leads generated, or deals closed and have them displayed.
So now, you may want to dive into why something happened. It may not be enough to see a number increase and not know why.
A famous example of this is the fact that ice cream consumption and city homicide rates are highly correlated. Obviously, ice cream isn’t the cause of crime. However, crime tends to increase in the warmer months when people are out more. And as you can imagine, ice cream sales increase during that time. So without having a tool that can help you dive into the whys, certain assumptions can be incorrectly made.
A robust analytics tool can help you discover this information. It should also include some AI and Machine learning capabilities to help you ask questions in a natural language format and help provide predictions based upon the data it has.
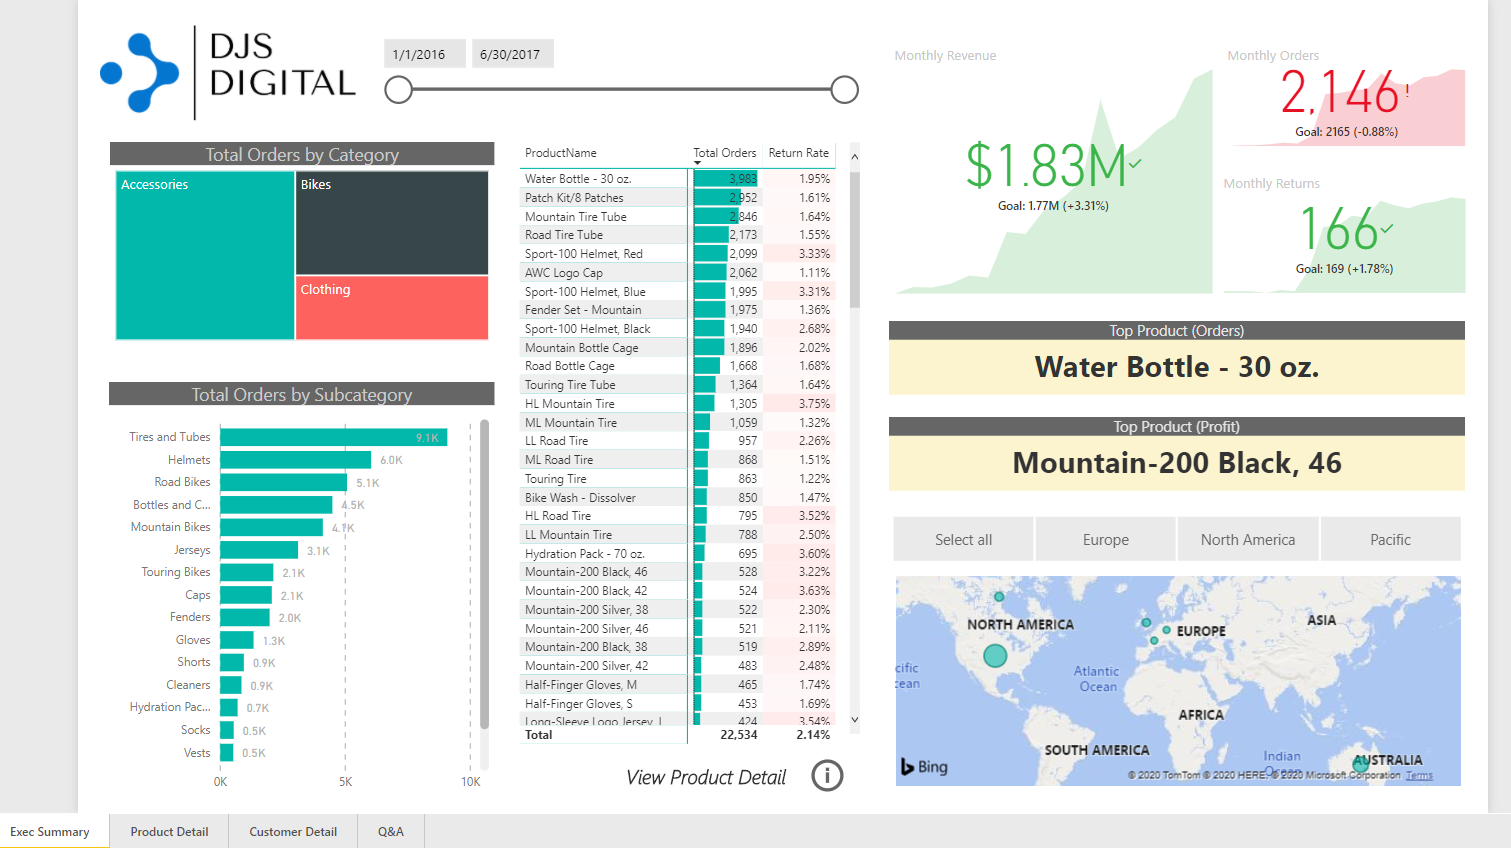
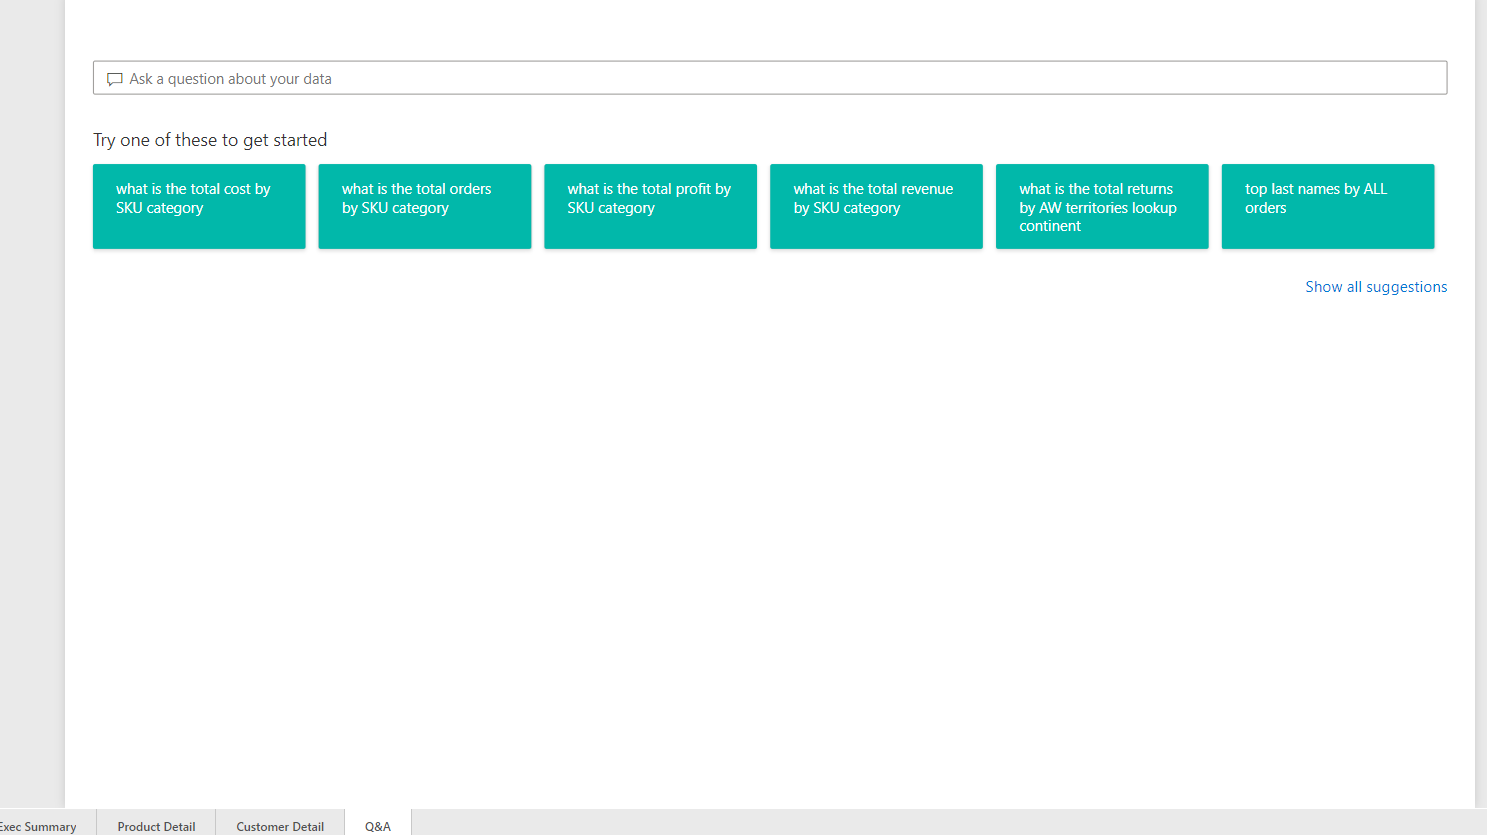
Below is an example of a report I created in PowerBI. I added a Q&A page to allow you to ask questions about the data. See the screenshots below.
If you would like further information on this topic or discuss how these tools can help you, email info@djs-digital.com.